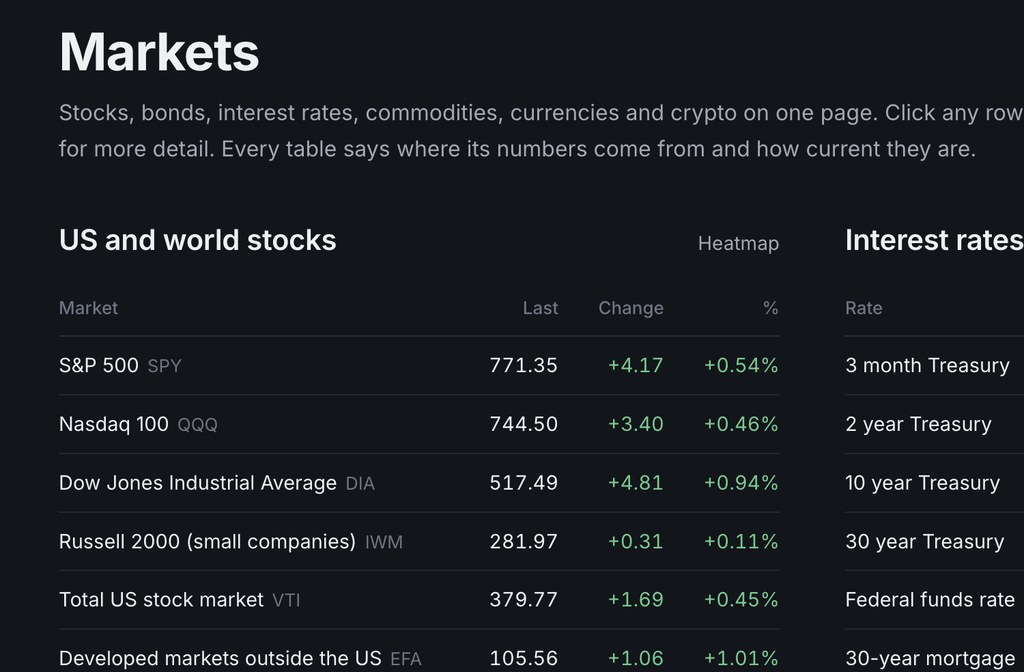
The FQS site looks different as of this week. Most of the work went into two things: opening up the lessons, and adding a Markets section with real data in it.
The Lessons Are Open
All 200 lessons have their own pages under Learn, and anyone can read them without an account. You still need to sign in to take the quizzes, try the activities and earn points. If you're signed in, the Learn page shows which lessons you've finished and has a button that takes you to the next one.
Old links to the Lessons and Curriculum pages still work. They send you to Learn.
A Markets Section
Markets is the new menu at the top of the page. The overview has the major indexes, Treasury yields, the biggest gainers and losers, commodities, currencies, sectors and crypto on one page.
Every US stock also has its own page. Type a ticker into the search box, or go to something like /quote/AAPL. There are tabs for key statistics, the company profile, dividends, news and the company's SEC filings. The Financials tab has the income statement, balance sheet and cash flow statement, taken straight from the company's 10-K and 10-Q filings: six years of annual numbers and two years of quarterly ones. You can download any statement as a CSV and open it in Excel or Google Sheets.
There's also an earnings calendar, an IPO calendar, and about 40 economic data series from the Federal Reserve's FRED database, like unemployment, inflation and mortgage rates.
What To Keep In Mind
We use free data sources, so prices are delayed. A lot of the time you'll be looking at the previous day's close, and each table says which day its numbers are from. A few numbers are missing on purpose. For companies with more than one class of shares, like Visa, the P/E ratio is left blank because the earnings per share in the SEC filings don't line up with the shares that trade.
None of this is meant for real trading decisions.
Smaller Changes
The Daily Trading Floor has a new look. The game and the scoring are the same. The strategy tester had stopped loading prices, and that's fixed. It now pulls ten years of daily prices with dividends included.
The site should also work properly on a phone now, trading floor included. If something looks broken, use the Report link at the bottom of any page.